#datavisualization

8 posts · Last used 29d

☝️ What happens when you treat terrain morphometry like satellite bands? ⚙️ An experimental RGB composite of an industrial micro-catchment in Kryvyi Rih, synthesized directly from DEM hydro-conditioned derivatives: 🔹 Red: Channel Network Distance (hydraulic connectivity) 🔹 Green: Total Catchment Area / Flow Accumulation (upscale contributing mass) 🔹 Blue: LS-Factor / Slope Length-Steepness (RUSLE physical erosion capacity). ⚙️ The color mixing immediately separates the basin into physical domains: 🔹 Bright magenta/neon ribbons: Critical erosion and transport vectors where steep slope length converges with active channel flow. 🔹 Vibrant green zones: Planar accumulation sectors and potential geochemical sedimentation traps. 🔹 Dark interfluves: Geomorphologically stable plateau surfaces. #Geomorphometry #Hydrology #SpatialData #RStats #SAGAGIS #TerrainAnalysis #DEM #EnvironmentalGeology #GIS #DataVisualization #InhuletsRiver
0
0
0
0
Decided to have a bit of fun on the 🚄 🌡️ Summer Heat Trends (1960–2025): Rome, Paris, London, Edinburgh 🔥 Rome leads with avg. daytime temps rising from 27°C (1960) to 32°C (2025). Paris, London, and Edinburgh also show steady increases, with extreme highs climbing across all cities. And some people still think global warming doesn't exist??? 🥵🥵 📊 Data Sources: Rome: Climate-Data.org, Holiday-Weather Paris: Weather & Climate London: Met Office, Weather Spark Edinburgh: Introducing Edinburgh, AccuWeather #ClimateChange #GlobalWarming #DataVisualization #SummerTrends
0
0
0
0
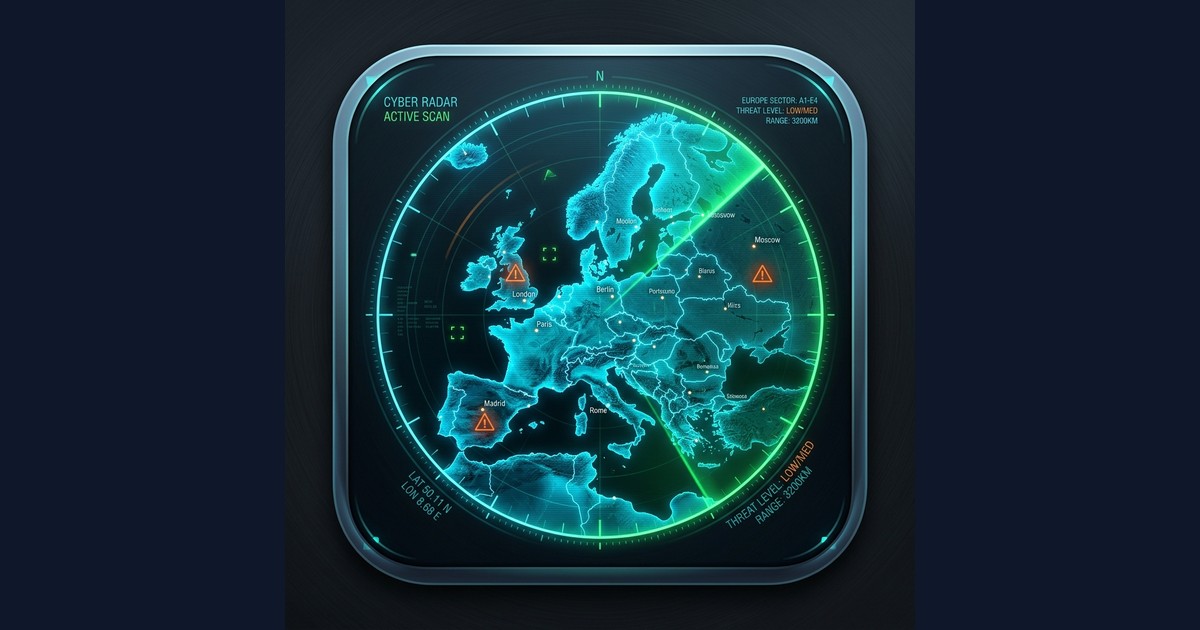
Was ist das Situation Deck? 🚨 Ein Projekt mit dem Ziel, kritische Gefahren-, Wetter- und Krisenwarnungen aus zersplitterten nationalen und internationalen Quellen zentral, in Echtzeit und übersichtlich auf einer einzigen interaktiven Karte zu bündeln. Krisenmanagement auf einen Blick. Hier sind die neuen Zahlen zum Update: 🌍 Skalierung: Über 740 aktive Messpunkte & Regionen (Flächendeckend in Europa, Ukraine sowie globale Hauptstädte und kritische Infrastruktur). 📡 Quellen: 7 gebündelte APIs (Meteoalarm, NINA, GDACS, USGS, Safecast, UA-Alerts, WMO) laufen in einer einheitlichen Pipeline zusammen. ⏱️ Performance: Ein dedizierter Background-Scheduler ruft alle 5 Minuten neue Warnungen ab – vollautomatisiert, 24/7. 🌐 Features: Smarte Filter-Logiken, ein 48h-Historien-Slider und Echtzeit-Übersetzungen von Warnmeldungen in 25 Sprachen. Jetzt live ansehen und ausprobieren: 🔗 https://situation.lemue.org #SituationDeck #Krisenmanagement #OpenSource #DataVisualization #Katastrophenschutz #Hitze #Erdbeben #HitzeWelle
2
0
10
0
Boosted by @fedicat@pc.cafe
Replying to
Well I couldn't find one, so I put this together based on data from https://fedilist.com/instance Almost half of active Mastodon users are now on version 4.6, nice! #mastodon #fediverse #data #dataviz #DataVisualization
4
0
3
0
You've seen all posts